


There is a version of the next six weeks that most investors are not running. Not because the data is hidden. Because each piece of it, in isolation, sounds like something you have heard before. Put them together and the picture gets more interesting.
Here is what is converging right now.
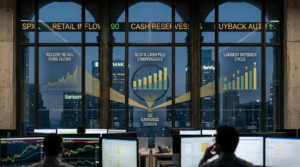
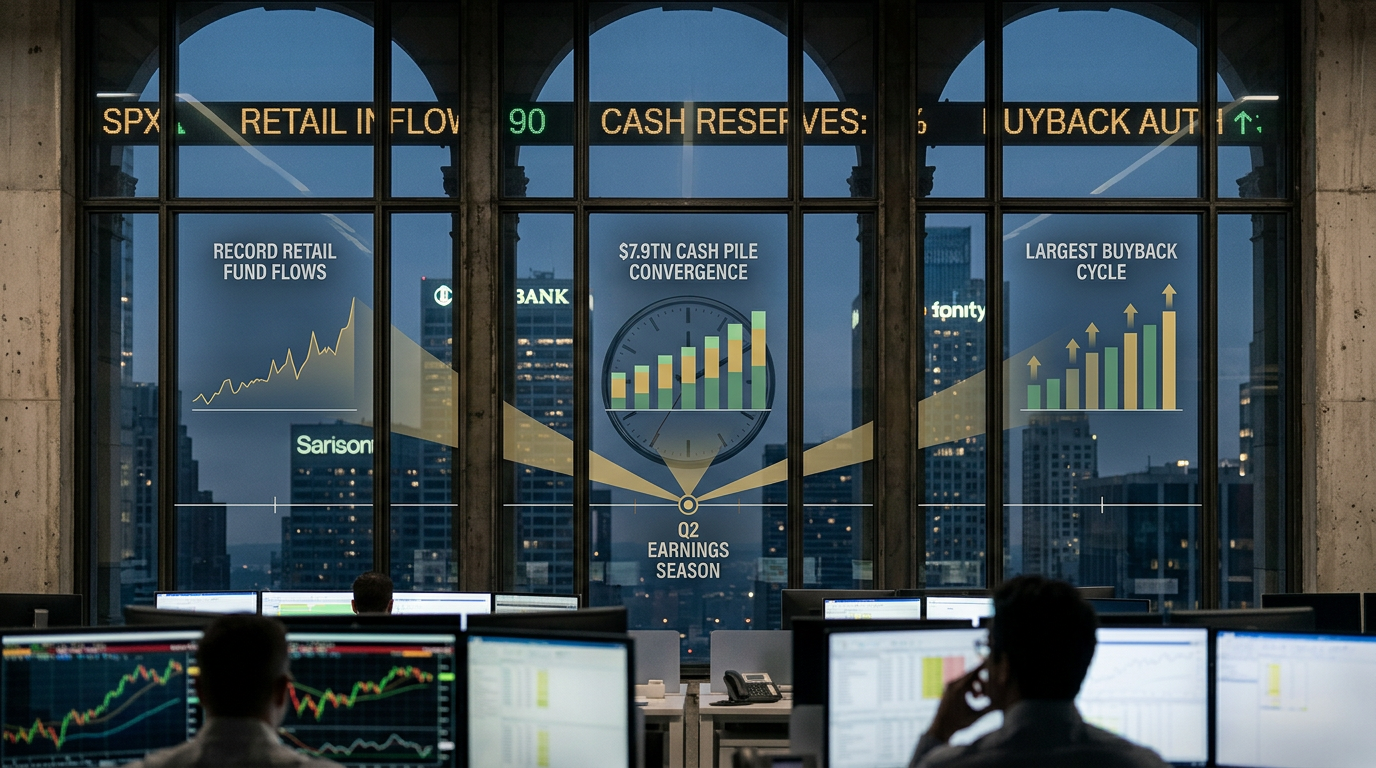
First: the corporate bid. S&P 500 companies authorized $665 billion in share repurchases in just the first four months of 2026, the most ever to start a year, according to Birinyi Associates. Goldman’s buyback desk puts the full-year annualized run rate at $1.15 trillion, also a record. That matters for one specific reason: that bid disappears during earnings blackout windows. Roughly 80% of the S&P 500 enters a repurchase blackout in the three to four weeks surrounding their earnings release. When $4.5 to $5.5 billion of daily corporate demand steps away from the market, the floor gets thinner. But here is the flip side of that math that almost nobody is trading: the blackout ends the moment earnings are reported. That means the largest single buyer in the U.S. equity market comes roaring back into the open window in late July, just as mega-cap tech finishes reporting. The corporate bid returns at full force with fresh authorization and a full treasury.
Second: the cash mountain. Total U.S. money market fund assets sat at $7.90 trillion for the week ended June 24, according to the Investment Company Institute. Of that, retail investors alone hold $3.08 trillion, also a record. That pile was built when the Fed funds rate was above 5%. It is now being nudged toward risk as short-term yields drift lower. The 6-month T-bill yield has already compressed from above 5% to around 4%, and the spread versus equities is narrowing every week. The institutional tranche, $4.82 trillion, tells a different story. Most of it is functional liquidity, it is not going anywhere. But retail money market assets do not have that structural anchor. They follow yield. And yield is going the wrong direction for cash holders.
The math on even a partial rotation is not subtle. A 10% shift of retail money market assets into equities would inject roughly $300 billion into the market. That is not a prediction. It is context for understanding what the demand side of the ledger looks like if sentiment firms up.
Third: retail itself. This is the part that is genuinely new and still being underestimated.
Retail investors now account for roughly 36% of daily U.S. equity volume, with record options activity and approximately $40 billion in monthly net inflows. Nine of the ten most active trading days ever recorded on Citadel Securities’ platform occurred in the last two months. June 12 marked the largest single day of retail net buying ever observed, surpassing the prior record by 50%. On S&P 500 down days during the first half of 2026, retail investors bought nearly 3.5 times the average daily amount. That buy-the-dip behavior, held consistently across a six-month period, is no longer a sentiment reading. It is a structural feature of how this market functions.
Slight tangent, but it matters: by May 2026, average daily options volume hit an all-time high of over 73 million contracts. Retail options premium on Citadel’s platform hit a record $6.8 billion per day in June, 17% above May’s record, and more than double the historical average. Of that, approximately $1.9 billion per day was in semiconductor options alone, with roughly 75% of that concentrated in calls. Retail is not just buying stocks. It is building leveraged upside exposure to the sectors driving index performance. That changes the vol profile in a meaningful way when the underlying bid accelerates.
Now here is the part worth sitting with. All three of these forces — the corporate buyback machine, the $3 trillion retail cash pile, and the record retail participation rate — are pointing in the same direction. And they are converging at the same moment: the Q2 earnings reporting window opening in mid-July.
Q2 earnings season begins in earnest the week of July 14, when Citigroup, Wells Fargo, Goldman Sachs, and Bank of America all report, with JPMorgan expected on July 15. Big Tech follows later in the month. FactSet projects S&P 500 earnings grew 22% in Q2, which would mark the second consecutive quarter above 20% growth, the first back-to-back reading of that magnitude since Q4 2021. Analysts actually raised Q2 estimates by 3.4% during the quarter, the opposite of the typical pattern where estimates fall by an average of 2.7% over the prior ten years. Companies issuing positive guidance for Q2 are running above their five-year average.
The setup is not uniformly bullish. There are real questions embedded in that earnings calendar. Banks will reveal how much net interest margin pressure has built from elevated deposit competition. The consumer discretionary sector has shown softening revenue and free cash flow relative to the broader market. Low consumer confidence creates a ceiling on discretionary spending that companies will have to address on guidance calls. And the broader market concentration story does not go away: the ten largest S&P 500 companies still account for nearly 40% of the index, a level that has been near record highs for the better part of a year.
What investors are missing is not the bullish data or the bearish data. It is the timing sequence. The buyback blackout removes the corporate floor just as earnings catalysts hit. If reports disappoint, there is less cushion. If reports impress, the corporate bid re-enters a market simultaneously receiving a retail options feedback loop and facing potential money market rotation pressure from declining short-term yields. The asymmetry in the upside scenario is larger than most models account for.
Where the Options Market Is Positioned
With retail options volume at record levels and semiconductor call buying running at 6x historical averages, implied volatility on individual names heading into earnings is elevated but not extreme. The average 3-month implied volatility on the ten largest semiconductor companies has more than doubled over the past decade, now running near 72%, reflecting a structural repricing of leadership-sector vol rather than a cyclical spike. That creates specific dynamics around earnings: the expected move is priced wide, which means directional bets carry a higher premium cost. Defined-risk structures, spreads rather than outright calls, reduce the premium burn while maintaining exposure to the upside scenario.
For traders expecting the post-earnings buyback resumption thesis to play out, the cleanest expression is in names with the largest pace-of-buyback relative to float: Apple, Meta, Alphabet, JPMorgan, and Bank of America all run programs large enough that their re-entry into the open window after blackout creates measurable, historically documented demand. Pair that with improving earnings catalysts and the retail call-skew already in place, and the feedback loop becomes self-reinforcing.
For those skeptical of the melt-up path, the risk case has a specific shape: if earnings guidance disappoints broadly, the money market pile stays where it is, retail momentum reverses, and the corporate bid is still days away from re-entering. That three-to-four week window between blackout start and earnings completion is the market’s most structurally thin moment of the quarter. It is the window where weak guidance does the most damage.
The Structural Question Behind All of This
The defining story of the first half of 2026 has not been a macro shock. It has been, as Citadel Securities put it in their H1 market structure review, “the continued structural transformation of equity markets.” Concentration, passive dominance, retail participation, leverage, and volatility are no longer independent variables. They reinforce each other. The fastest growth in equity ownership is occurring among households that historically had the lowest market participation rates, with the bottom 50% of U.S. households now holding a record $615 billion in equities and mutual funds, up 571% since 2010.
U.S. households held $55.15 trillion in corporate equities and mutual fund shares in Q1 2026, with equities making up 45.76% of household financial assets, near a series high. That concentration of household wealth in equities creates a reflexive quality to the market: when stocks go up, household wealth rises, confidence follows, and participation deepens. When stocks go down, the reverse happens faster than it used to, because more households are exposed and more of them are active traders rather than passive holders.
That is the risk embedded in the current moment that is not being fully priced. The market’s demand structure is historically strong. But it is also more reflexive, more concentrated, and more leveraged at the retail options layer than it has ever been. The three-buyer convergence around earnings season is a real dynamic. So is the fragility that comes from a market where three concurrent demand forces can, if sentiment shifts, all reduce exposure at the same time.
The corporate profits picture provides some fundamental grounding. Total corporate profits hit $4.4 trillion in Q1 2026, up 12.8% year over year. Buybacks are funded by genuine cash generation, not leverage. S&P 500 earnings are now projected to rise more than 22% for the full year 2026, up from a 17% forecast at the start of Q2. That revision higher, during a quarter when estimates typically fall, is the data point that the bears have the hardest time explaining away.
The next thirty days are where the thesis gets tested. Banks report first, then the industrials, then Big Tech. What management teams say about the second half, about credit quality, capital expenditure plans, and consumer health, will either validate the demand convergence picture or expose the gaps in it. The history of Q2 earnings seasons with back-to-back 20%+ growth is short. There is no clean template for what comes next. That is, in its own way, the most interesting thing about the current moment.
- Watch: Corporate buyback re-entry timing relative to individual earnings release dates for Apple, Meta, Alphabet, and the major banks
- Watch: Retail money market fund weekly flows from ICI for any acceleration in outflows toward equities as T-bill yields compress
- Watch: Q2 bank earnings guidance on net interest margins and commercial real estate exposure as the first read on credit health
- Watch: S&P 500 options call skew in the week following major earnings reports as a real-time gauge of retail feedback loop re-engagement
- Watch: Equal-weight S&P 500 performance relative to cap-weight as a breadth signal for whether the demand convergence is lifting all boats or concentrating in the familiar handful
- Risk factor: The buyback blackout window itself, the three-to-four week period when the corporate floor is thinnest, coincides exactly with peak earnings volatility. Any broad guidance disappointment in that window hits the market without its largest systematic buyer present.